

Applus Services S.A (BME: APPS)
An underappreciated Spanish company within the TCI industry

This is my first post on Substack. I have previously posted on my twitter, Thepiccledotcom, however with limited ability to go in depth due to twitter’s character-limit policy. As such, I intend to post longer write-ups here (when time permits) to calibrate my thought process and evaluate my own analyses as time progress.
Preface + a bit of background
When I first glanced over Applus Services S.A. (BME: AAPS), I thought it would make a great candidate for a leveraged buyout (LBO). As someone who has worked in LevFin for a couple of years, I have encountered several LBOs that share similar characteristics with Applus. I later found out that The Carlyle Group had already completed an LBO of Applus in 2007, purchasing the company for an enterprise value of €1.48 billion (EV/EBITDA of ~19.5x vs. 2007 peer average of around 13.5x), making it the largest transaction of its kind (PE) in Spain at the time. In 2014, Carlyle and its co-investors mostly divested their stake in Applus by listing it on the Madrid Stock Exchange at an EV €2.6 billion. Two years later, after the lock-up period expired, Carlyle sold the rest of its stake directly to Southeaster Concentrated Value (SCV) at a price ~40% lower than the IPO price. While it may seem that Carlyle was in a hurry to exit, it is not uncommon for private equity firms to take whatever they can get once the lock-up period ends.

Subsequently, SCV sold its entire position before re-establishing a new position in Applus Services S.A. a few years later, which the fund refers to as a "recycled" investment. Currently, SCV holds approximately 5.5% of Applus (according to CapitalIQ). I don't have enough information about SCV's performance history to let it affect my perspective on Applus - just thought it was interesting.

Applus Services at a glance
Headquartered in Barcelona, Spain, Applus is a leading provider of mission-critical testing, inspection, and certifications (TIC) with operations across >70 countries and employing >25.000 FTEs. Given the company’s defensible market position, sticky and diversified customer base (top 100 clients account for 51% of FY21A sales), limited CapEx and working capital investment needs, and the fact that a significant portion of sales are contracted, Applus operates with a high degree of financial visibility. The company’s operations are divided into four segments:
Energy & Industry (55% of FY22A sales)
Applus' energy and industry (E&I) division employs the company's proprietary technology to conduct infrastructure testing and inspection services for various industries, including oil and gas (O&G), renewable energy, telecommunications, aerospace, and mining. Its services range from general inspection and certification to non-destructive testing, engineering and consulting, and quality assurance/control.
The E&I segment has a significant exposure to the O&G industry, representing ~50% of the division’s FY22A sales which has contributed to a nice uplift in FY22A as a consequence of the industry-wide increase in activity. However, in the longer term, Applus aims to piggyback the transition toward sustainable energy solutions by growing its presence within wind, solar and nuclear energy. This shift is highly prioritized on the political agenda, supported by the European Union's REPowerEU plan. Moreover, the increasing emphasis on energy efficiency in infrastructure/buildings has raised the need for environmental, health, and safety controls, which is also supported by the European Union's Renovation Wave Strategy - representing an opportunity for Applus.
Automotive – statutory vehicle inspection (22%)
Applus' automotive division offers technical inspection services to ensure vehicles meet safety and emissions regulatory standards in jurisdictions where periodic inspections are compulsory. The division's revenue comes from contract-based tender offers to regulated (78% of FY22A sales) and liberalized (28%) entities, providing a high level of revenue predictability. In fact, the division has already secured over 90% of its revenue for the next five years, and its record of winning 12 out of 13 tenders in the past six years adds another layer of comfort to the business model. The automotive division must keep up with legislative changes and maintain a detailed understanding of local requirements. Naturally, the demand for its services would increase with more government regulatory measures, and vice versa.
IDIADA (14%)
Through an 80% ownership in IDIADA (remaining 20% owned by the government of Catalonia), Applus provide testing, engineering and R&D services, and homologation (the process of certifying the “roadworthiness” of vehicles) to the world’s leading auto companies. The entire IDIADA partnership is contracted with renewals coming up in September 2024 where there will be a tender for a 20–25-year concession – significantly longer than the historical standard of ~5 years. Applus has been running the IDIADA business alongside the Catalonian government since 1999, and the management believe the odds of winning the tender are solid. While it is not the largest segment of Applus, it nonetheless represents a material proportion of sales and profits.
Laboratories (9%)
Through the smallest segment, Laboratories, Applus offer its clients state-of-the-art testing laboratories for product development, serving the Aerospace, Auto, Construction, Energy, IT & Cybersecurity industries. With tailwinds from the rapid adoption of electrified products, advancements in battery technology, and the growing presence of advanced materials, Applus’ laboratory services are well poised to take advantage of necessary testing involved in such innovations.
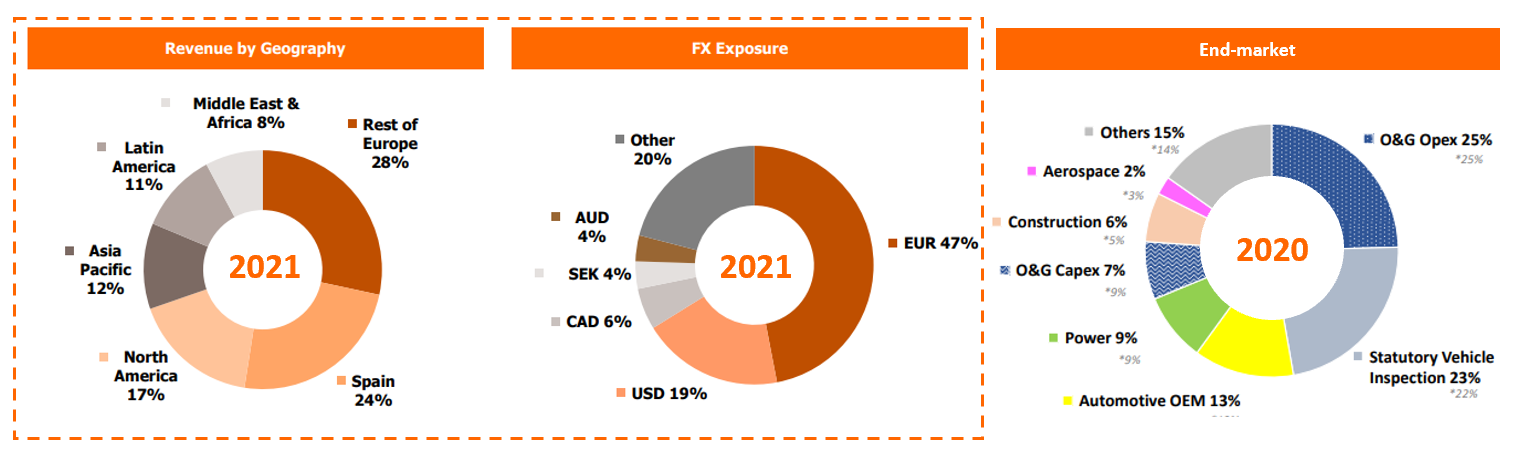
Below is an overview of the Group’s sales split across three variables. Although the information is from different years, it is sensible to expect it to be more or less the same split for 2022 given the quite stable development historically. The point, though, is just to illustrate the degree of end-market and geographical diversification:
Industry dynamics / Competitive position
The TIC industry consists of a broad range of services, covering testing, inspection, certification, consulting and audits that aim to address the performance and conformity of products, industrial assets or systems. Through such services, clients are sure to meet quality, health, safety and environmental (QHSE) requirements. In general, the demand for TIC services is driven by either regulatory requirements, industry/international standards, and/or client specific needs.
The market is characterized by high barriers to entry, such as:
Long-term client relationships: In the TIC industry, most sales are driven by contracts with a tenure of around five years. During this time, TIC providers become an essential part of the clients’ operations, leading to high switching costs. Consequently, contracts are usually extended with the existing provider, provided that the terms are reasonable for both parties.
Accreditations: TIC providers must obtain the proper authority to conduct certain inspections, depending on the laws in which such service is provided. Such accreditations are usually given by trusted organizations/government agencies, creating a level of trust between client and TCI provider.
Intricate know-how: The technical expertise required to operate in the TCI market serves as a significant barrier to entry – particularly in terms of multi-service offerings (economies of scale).
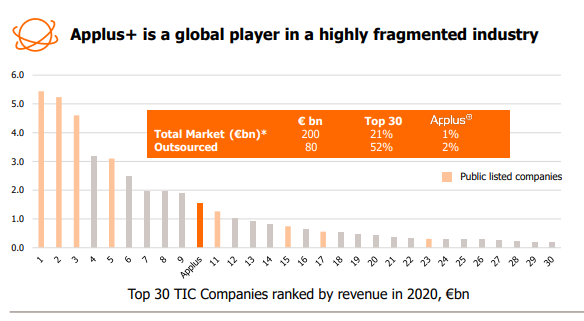
The market is fragmented with several small businesses offering niche TIC services locally. That said, there are several larger players too, all of whom have M&A at the center of its growth strategy. Applus points to eight publicly listed peers in their remuneration report (for benchmarking purposes). With a bit of backtracking, we can match each peer to its respective ranking in the graph above. Below is a list, sorted from largest to smallest based on FY20A (€) sales:
Eurofins Scientific S.E. (ENXTPA: ERF)
SGS S.A. (SWX: SGSN)
Bureau Veritas S.A (ENXTPA: BVI)
Intertek Group plc (LSE: ITRK)
Applus Services S.A. (BME: AAPS)
ALS Limited (ASX: ALQ)
Team, inc. (NYSE: TISI)
Mistras Group, inc. (NYSE: MG)
Core Laboratories N.V. (NYSE: CLB)
Now lets update the data to see how it looks from a FY22A perspective:

Interestingly, SGS S.A. has surpassed Eurofins in terms of revenue. Also, Applus has closed some of the gap to Intertek. That said, top-line growth is not necessarily an indication of value creation. We’ll get back to the peers in the relative valuation of this write-up.
With secular tailwinds (QHSE awareness), driven by increasing regulatory requirements, need for energy self-sufficiency, and energy efficiency initiatives, the TIC market is expected to grow at mid-single digits in the decade to come. A market report from Fortune Business Insights point to a 6.1% CAGR from 2022 to 2029 resulting in a projected total market size of $328 bn (~€310 bn). It is noteworthy, however, that the primary driver of this growth is expected to come from the healthcare industry where Applus have a limited presence.
Financial development
Upon analyzing the financial development from FY15A to FY22A, it becomes evident that the business is relatively stable and predictable, with the exception of the impact caused by C-19. This was kind of expected in light of the characteristics outlined in the previous sections.
During FY15A-FY22A, some of the divisions have improved a lot while others have been more or less flat. Below illustrates the topline development and CAGR for each division:

Note how the slight decline in E&I is affecting the overall CAGR of Applus – a testament to the relative size of the E&I division compared to the other divisions. Although E&I’s proportion of total sales have been declining, it still accounts for ~55% of FY22A sales.
Applus has been (and still is) on a journey to consolidate the TCI industry, regularly acquiring bolt-on local TCI operators. This recurring M&A activity adds a layer of noise when interpreting the financial development. Below is an overview of the underlying contributors to the topline growth during the seven-year period:

In later years, aside from FY20A, organic growth has been hoovering around 5% which is comforting.
Now, lets look at profitability. Applus’ management are fond of highlighting “adjusted EBITA” where “Other results and amortization of acquisition intangibles” are consistently backed out of EBIT together with one-offs when such items occur. I am a little bit skeptical of this approach as it provides quite a lot of freedom to manage earnings and thus overstate profitability. Nonetheless, here is an overview:

Below is a comparison of the communicated adjusted EBITA relative to the my adjusted EBIT. I am adjusting for restructuring charges, impairment of goodwill, gain (loss) on sale of invest, gain (loss) on sale of assets, asset writedown, and other unusual items. If an item appear to be recurring across years, I have excluded it from the adjustment:
The difference seems to be quite steady at ~3% which is not as bad as feared. I would have been more concerned if the difference was fluctuating significantly.
Here is an overview of the Group’s revenue development alongside my adj. EBIT and management’s adj. EBITA margins. I could dig deeper into the discrepancy in FY20 adjustments, but since FY20 itself was an odd year across the board, I will spend my time elsewhere:

Question remains whether value has been created for investors. ROIC is my preferred way of uncovering shareholder value creation, using adj. NOPAT and average invested capital. A part (40%) of goodwill has been excluded from invested capital. The reason why I am not excluding 100% of goodwill rests on the fact that much of Applus’ growth is attributed to M&A, and thus I want to know the ROIC generated above and beyond the premiums paid for targets. Since Applus follow IFRS 16, there is a limited need for adjusting R&D capitalization or operating leasing.
ROIC is useless without a comparison to WACC. Hence, I have tried to compute the historical WACC based on book values (incl. 2% small cap premia to cost of equity). Here is an overview.

Ideally, I want to see a consistently wide spread. While the spread was negative in the past, it does seem to have reversed a bit. Again, I am ignoring FY20.
Let’s see how investors have been treated during the same period:
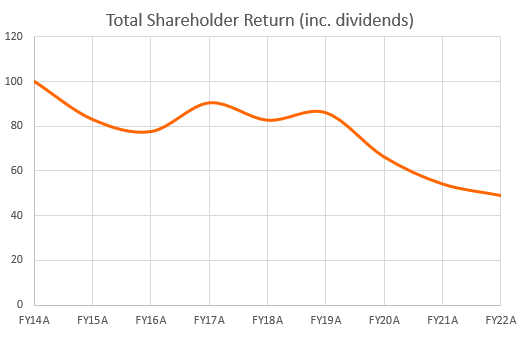
Ouch. A CAGR of -8.6%... The sell-off has continued even after ROIC is showing signs of improvement. High expectations must have been priced into the company in 2015.
Looking forward + risks
As Applus moves away from the O&G sector, I anticipate some divestments in the upcoming years. In fact, I would have already expected divestments in the E&I division, but it appears that there is currently a lack of interest, no attractive offers - or maybe even a preference on behalf of Applus’ management to wait a bit longer. The strategic plan for 2022-2024 includes divestments as a means of funding future M&A activities. Therefore, any announced divestments should be welcomed by the market, provided Applus does not sell at an unreasonably low price.
M&A is a crucial element of Applus' capital allocation. The management has clearly communicated their dedication to a prudent capital allocation strategy, weighing the potential value addition from M&A against returning cash to shareholders. In FY22A, the company completed 5 transactions and a share repurchase program, repurchasing 5% of shares outstanding. Another repurchase program of 5% is in full effect which is likely to provide some temporary support to the share price.


Below are some of the targets coming from the strategic objectives outlined in the 2024 strategic plan:

*Continuing operations. **Excluding accelerated D&A related to the IDIADA contract expiry
Peer overview and relative valuation
Here is a comparison of the four larger peers’ stock market performance over the past five years:
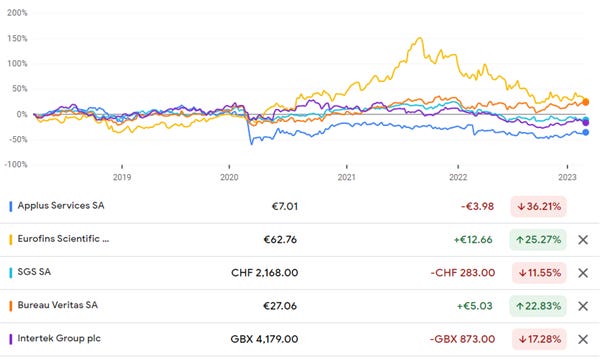
It could be argued that including Eurofins as a peer is somewhat of a stretch, as Eurofins exclusively runs laboratories for testing food, pharmaceuticals, cosmetics, etc., while Applus and other peers have a greater focus on industrial end-markets. Nonetheless, here is a high-level summary of the profitability and trading multiples of each company:


Generally, I don’t put too much emphasis on multiples. From above, it is evident that Applus trades at a discount to its peer group. The averages are influenced biased upward by CLB and TISI, which are outliers. When we adjust for these outliers, the discount appears to shrink a little.
Overall, there seems to be a lack of optimism for Applus at current levels, which could be advantageous for prospective investors. Speaking of expectations, utilizing a reverse DCF based on consensus estimates, as per Michael Mauboussin's approach, it would take no more than four years of free cash flow to justify the present price. However, it is important to take this with a grain of salt, as a reverse DCF is not as free of assumptions as some make it out to be.
DCF model
I model three scenarios: A bull, base, and bear case. Growth rates and profitability of each scenario is shown below:
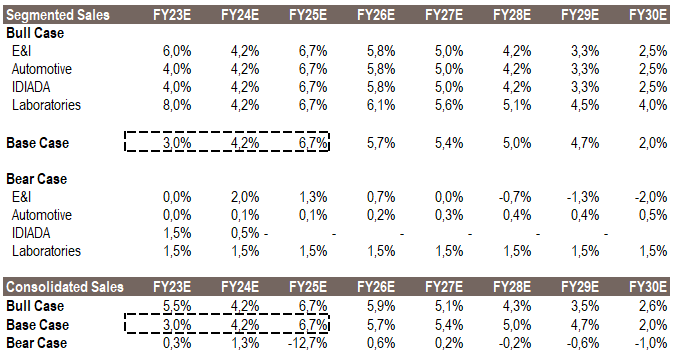
The bull and base case both assume a contract extension for IDIADA, whereas the bear case doesn’t. The base case uses consensus estimates from FY23E to FY25E before tapering growth linearly to 2.5% in FY30E. It is interesting, though, that consensus estimates for revenue FY23E is lower than managements’ guidance of mid-to-high single digit growth. I think there is a good chance of an upward revision by analysts as the year progress.
Overall, the estimated topline is growing slower than the market estimates put forth by industry experts mainly due to the fact that most of the industry growth is expected to be driven by a segment (healthcare) where Applus has limited presence.
Profitability wise, the bull case assumes a historical high levels yet in line with most peers (as per the previous section), the base case assumes a flat - but slightly higher than historical averages, and the bear case assumes a return to historically low levels.

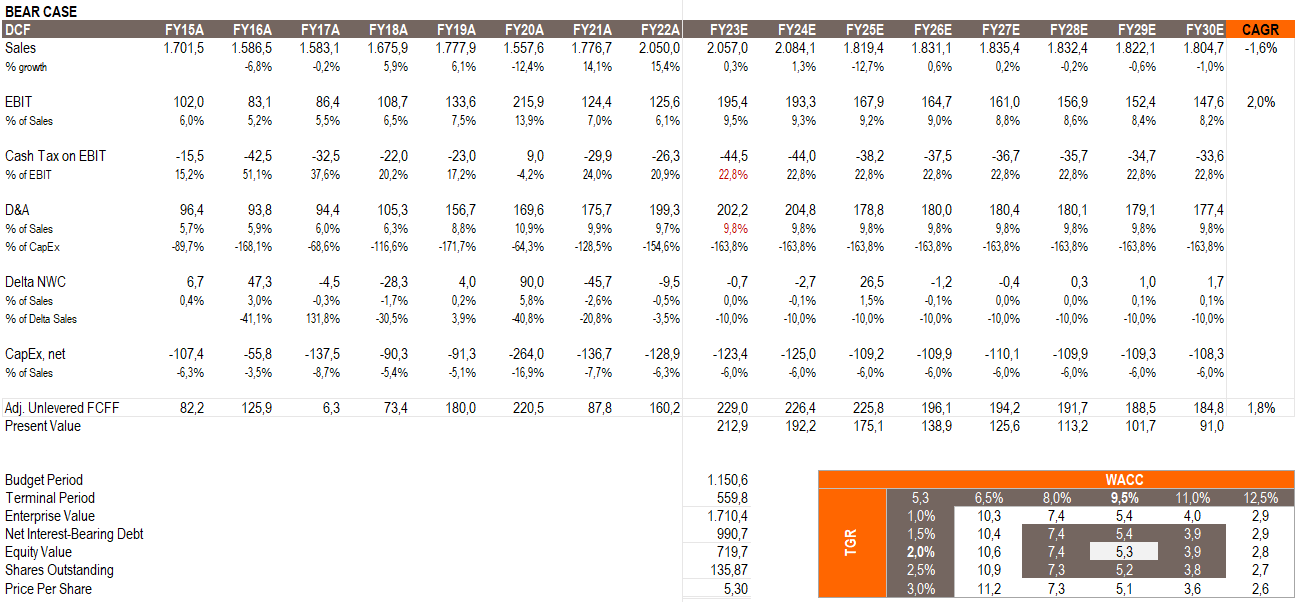
All scenarios assumes a cash tax rate of 22.8%, D&A at 9.8% of sales, incremental NWC of 10% of sales, Net CapEx at 6%, TGR at 2%, and WACC at 9.5%. However, RONIC for the computation of the terminal period varies, with the bull, base, and bear case assuming a RONIC of 12.5%, 9%, and 7.5%, respectively. This results in the following share prices:
Bull case: €16.8
Base case: €12.6
Bear case: €5.3
Here are the outputs:


Conclusion
As I was examining Applus over the past 2½ weekends, it managed to return >15%, of which 10% came on Friday the 10th of March (two days ago). It is still unclear to me exactly what caused this move. While it would have been nice to have had published this write-up prior to the big jump, the stock is still trading within my buy range.
My target price is in the ballpark of €13. I believe there is a good chance that the stock will produce attractive returns over the coming 12-18 months as management will guide the company back into positive ROIC-WACC territory, aided by the favorable underlying industry development and the company’s improved incentive program. It also wouldn't surprise me if a private equity firm tries to takes the company private if Applus continues to trade at single digits.
If you made it this far, thank you! Do not forget to follow my twitter, Thepiccledotcom.
The move came from the news that some private equity firms are looking at Applus.
I own Applus, but I'm still wondering if it's truly cheap, or just cheap compared to it's (overvalued?) peers.
Interesting pick. you would need a business inflexion from past trends to produce returns I think, as past grow is very weak and dividend is very low. I like that they are increasing buybacks.
the real question is what is going to happen with the Energy testing organic growth? have you looked at this? Many people are quite bullish on O&G capex