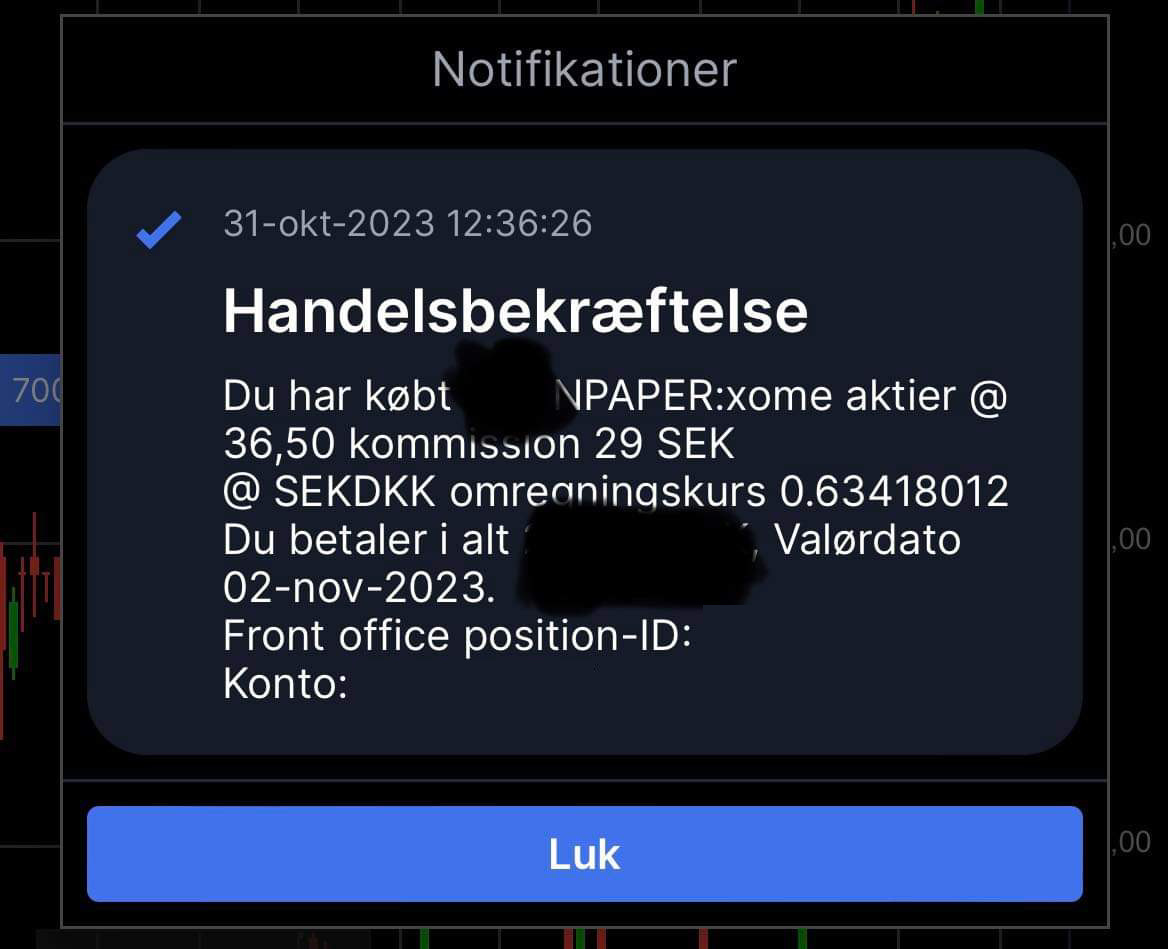
I had originally planned to post this write-up prior to the Q3 results (released yesterday), but have been distracted by my busy schedule as of late. It is always sort of bittersweet to post after a recent run and claim the returns with no proof. So, just to be in the clear, below is a screenshot of my latest order (filled during yesterday’s intra-day lows):
OBS: This write-up is of less detail compared to some of my previous ones, but I have tried to elaborate on the most critical assumptions. If anything is unclear, feel free to shoot me a message on twitter (@thepiccledotcom) and I will happily share my model and/or expand on my thoughts.
Preface
With the Swedish krona at all-time lows relative to the Euro, I have been on the lookout for high-quality businesses with international reach (i.e. a lot of exposure to non-SEK currencies), trading at bargain prices. In other words, I have been looking for double-discounts, valuation and currency, with the latter being icing on top (a call option if you will). However, it is still important to me that the company still fits into my investment philosophy which I don’t think I have ever formally put forth– so I guess this is a good opportunity to do so. Here is a non-exhaustive list:
Simple/understandable business model
Financial visibility/predictable
Free-cashflow generative
Durable competitive advantage/moat
Market leader within its niche
Pricing power/ability to protect margins
Limited exposure to macroeconomic events
Diversified customer and supplier base
Solid prospects of future growth
Run by brilliant people
Owned by rational owners
Low levels of debt
And the list goes on :-)
I am generally agnostic to company size, but naturally tend to gravitate toward small/mid-cap companies. In many ways, I try to replicate a PE investment style on public markets (cliché, I know). With rates up, high direct lending appetite, and sell-off of small and mid-cap companies, I expect to see more P2P transactions to come through in the coming years. In fact, two (BME:APPS and CPH:HART) of my write-ups have been (or are in the process of being) taken private since I first started posting my analyses ~1 year ago. I believe this write-up have solid grounds to be the third member of the take-private club. Lets jump in!
Nordic Paper at a glance
With roots dating back to 1871, Nordic Paper is a Swedish-based company offering specialty paper products to a wide variety of end-use applications, ranging from carrier bags and sacks to baking paper, and other food-related applications. A core element to the company’s value proposition is the sustainability of its offerings vis-à-vis its plastic counterparties (i.e., transport packaging for e-commerce, food packaging, shopping bags, etc.), something that weighs heavy on the climate change agenda.
Operations are divided into two segments:
Kraft paper (53% of LTM Q3-23 sales)
Kraft paper is known for its strength and flexibility, making it well-suited for a broad range of applications, such as packaging for building materials (cement), food (flour), carrier bags, etc. The segment is divided into three additional subsegments; A) Machine finished paper (“MD”) (50% of FY22A segment sales), B) Machine glazed paper (“MG”) (25%), and C) Other (25%).
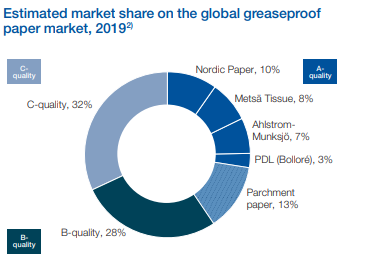
As shown in the charts above, Nordic Paper is a dominant player in the MF paper sector, and it shares the top spot with Mondi in the MG paper category. It's essential to keep in mind that these statistics are based on data from 2019, and there may have been significant developments in the industry since then. If anything, though, Nordic Paper have even increased their market share (according to managements Q3 commentary).
Counter to many of its competitors, Nordic Paper do not convert the paper into its end-product (i.e. sacks), but rather focus on championing the upstream activities associated with the production of the paper. This is pivotal to client relationships as they would otherwise compete directly with their own customers. Below is an owerview of the value chain, applicable to both the Kraft paper and Natural greaseproof paper:
The company’s kraft paper is produced from its own paper mill plants in Sweden (Åmotfors and Bäckhammar).
Natural greaseproof paper (47%)
Greaseproof paper is characterized by its resistance to grease and oil, and is mainly used for various types of applications in food packaging (10% of FY22A segment sales) and baking (90%). Counter to some of its competitors, the company’s greaseproof paper contains no added fluorochemicals (PFAS) which are known to be harmful to humans. Instead the cellulose fibres are processed mechanically to achieve greaseproof properties. This limits the legal and reputational risks of the company.
Within grease-proof paper, the competitive landscape appears more intense compared to the Kraft paper segment. However, it's crucial to bear in mind that Nordic Paper's primary focus is on natural greaseproof paper, setting its value proposition apart from providers of non-natural alternatives. This distinction gains particular significance in a world where the emphasis on natural products has grown considerably in recent times.
The company’s greaseproof paper is produced from its own paper mill plants in Sweden and Canada (Säffle, Greåker, and Québec).
With geographically diversified sales and sourcing, low customer concentration, limited cyclicality, high barriers to entry, long customer relationships, and a leading position in a fragmented niche, Nordic Paper benefits from many of the characteristics liked by financial sponsors (and myself). Below is a quick run-through of each element:
Diversified customer base of +840 accounts, of which the 10 largest account for 20% of FY22A sales.
Input material is sources from 1,700 active suppliers (data as of 2020; hence, likely higher now on the back of the Québec-acquisition).
Geographically diversified sales across Europe (65% of FY22A sales), Americas (19%), APAC (6%), and MEA (10%).
Given that paper and packaging in general permeates our day-to-day lives, an economic downturn is unlikely to affect the industry anymore/less than it would the broader economy. Adding to that, Nordic Paper can shift its sales mix accordingly and thus safeguard themselves somewhat from cyclical downturns, This is evident in the most recent quarterly result (Q3-23).
High barriers to entry as the production of paper is capital intensive and requires a certain level of technical knowledge.
c. 80 and 90% of sales are attributable to customers who have been with Nordic Paper for 6 or more years within Kraft Paper and Natural Greaseproof, respectively.
The kraft paper and non-grease paper market is a niche corner of the overall paper industry with several other small niche players as well as larger generalist paper producers.
That said, profitability is – to a certain extent - linked to commodity pricing, most notably wood and natural gas prices, albeit some of these can be hedged. If you recall my Brdr. Hartmann write-up, you would know that they are quite dependent on paper pulp prices. That is not the case for Nordic Paper as they are partially (74%) self-sufficient via its own paper pulp production factory, Bäckhammar. In fact, the company will invest SEKm 850 over the course of four years (‘23-’26) to expand the Bäckhammar site and thus become 100% self-sufficient - a strategically wise decision. Adding to this, the steam associated with the production of paper pulp currently generates enough electricity to power 25% of the company’s entire electricity need. With the expansion, this should improve to 30-35%.
Financial performance
Over the course of the last six years (data capped at 2017), Nordic Paper has grown its top-line by a CAGR of 7.9% with EBITDA margins hoovering around the 18%-mark (aside from a blip in FY21A). The sales growth is a function of three drivers 1) Pricing, 2) Volumes, 3) Mix. The former has been the primary contributor to growth. However, given the international scope of Nordic Paper, currency fluctuations also play its part. Below is a break-down of the top-line growth contributors:
Given the asset-heavy nature of the business, the EBITDA to FCF bridge is relatively steep - I estimate the normalized drop-through rate to be in the range of 40-50%.
Looking at the ROIC development, FY20 and FY21 were rough years given lower NOPAT (higher COGS) and the Québec-acquisition (FY21). However, it quickly bounced back to its historical average in FY22A:
Had you invested at the IPO (October 2020) at SEK 42/share, you would have made a 14% return based on Tuesday’s closing price (SEK 38.2/share), including dividends. A 4.4% annualized return is not something I’d be happy with - luckily it is something I expect to beat.
Valuation
Looking ahead, the consumption of non-bleached paper (be it Kraft or Non-grease) is projected to grow in tandem with a A) a growing middle class, B) changing eating habits (out-of-home/prepared meals), and C) Increased focus on sustainability both from a consumer and regulatory standpoint. As such, I expect volumes to grow, albeit at a slower pace than historically (CAGR of 1.8% vs. 2.1%). Here is an overview of how I model volumes to develop through FY30E:
I expect pricing to be slightly higher than that of volumes (in line with historicals and management’s own expectations). However, I expect to see more pricing power from the Kraft paper segment versus that of the Non-grease paper, mainly due to an expected retraction on non-grease paper pricing in FY24E. From FY25E and beyond, I forecast both segments to increase prices at approximately similar rate:
The product of the two graphs results in the total sales, shown below:
I also expect the company to continue flexing its sales toward the higher-margin Kraft Paper products. However, margins are not modelled to expand beyond its pre-pandemic historical average. This should be interpreted in light of management’s own 20% margin.
The recent investment into the Bäckhammar site will increase CapEx by a total of SEKm 850 across FY23-26 with FY24 and FY25 seeing the largest outflows (SEKm 300 each). As a result of this expansion, CapEx will be slightly above historical averages through FY26 before reverting back to its ~3.5-4% of sales level. As growth dampens in the forecast period, the incremental working-capital needs are similarly lower. My forecast is based on a ~14% NWC ratio, in line with historical averages. The cash tax-rate is calculated as 20.2%. With a 2% terminal growth rate, 15% WACC, and 18% RONIC, I arrive at a fair value per share of 46.5 SEK, representing a 30% upside.
Here are the relevant outputs from the DCF:


Plain and simple business - great write-up!